I recently added focus mode, a new feature in WATO that I hope will help you. Before I explain it, I’ll provide a quick recap.
What is WATO?
WATO is a tool that can help you figure out how someone fits into a family tree in a specific place based on the amounts of DNA they share with people in that tree. For more background on the tool, you can read the FAQ or watch my webinar. There are also some recent blog posts announcing other features:
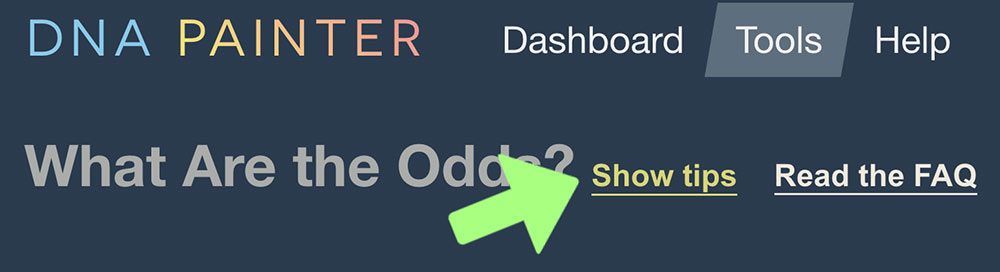
If you’re using the tool for the first time, I highly recommend clicking ‘Show tips’ at the top and reading it carefully.
Scores at WATO
After you’ve added at least one DNA match to your WATO tree, you can add a hypothesis. What you’re doing here is hypothesizing that the DNA tester might fit into the tree in this position. In response, WATO will assign a score.
Each score is calculated by:
- Calculating the likelihood of the individual relationships between the hypothesis and each match for the number of cM shared
- Comparing the compiled likelihood with those of other positive hypotheses
There will be cases when this score is zero:
- When this position isn’t possible based on the DNA amounts shared
- If this position isn’t possible based on birth or death dates
- Where the hypothesis is more than 1 million times less likely than the top hypothesis
Otherwise, the score will be 1 or more. If there’s only one hypothesis, its score will always be zero or 1.
Simple, eh!
You might have noticed that this is all incredibly confusing! Sometimes you might have a result that you don’t really understand. There is a score calculation table towards the bottom of every WATO tree, but not all users see this.
A little while ago there was a suggestion in the WATO Facebook group with a graphic that caught my eye. A user had copied and pasted the data from the score calculation table and put it inline. This meant that you could see far more quickly why a hypothesis was not valid, or why one scored higher than another. I resolved to incorporate this into the tool.
The new Focus feature
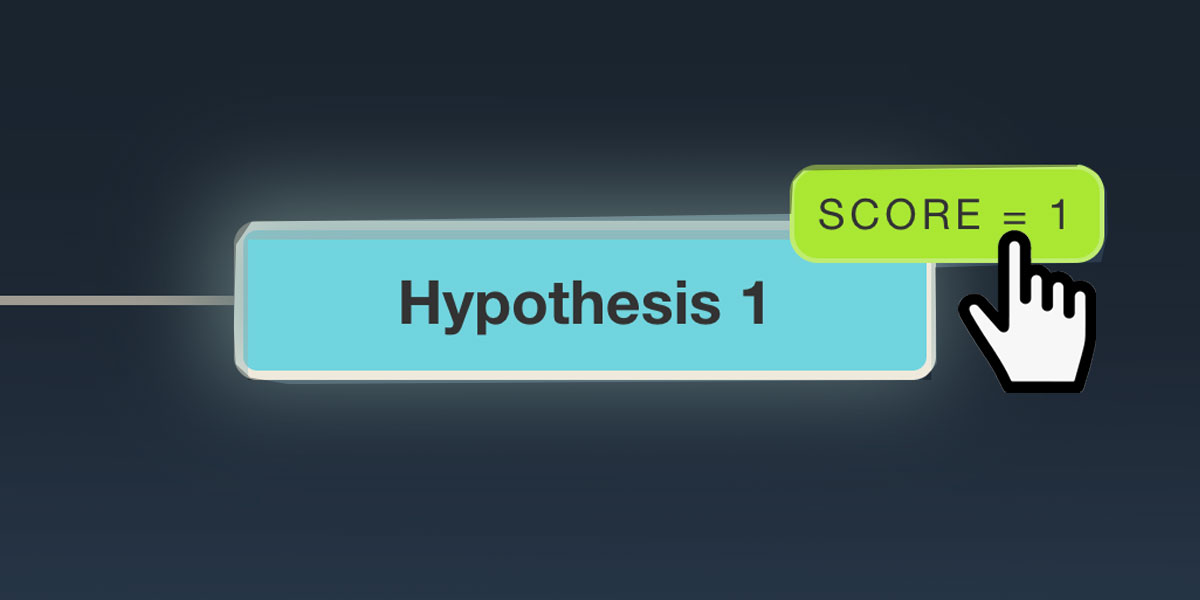
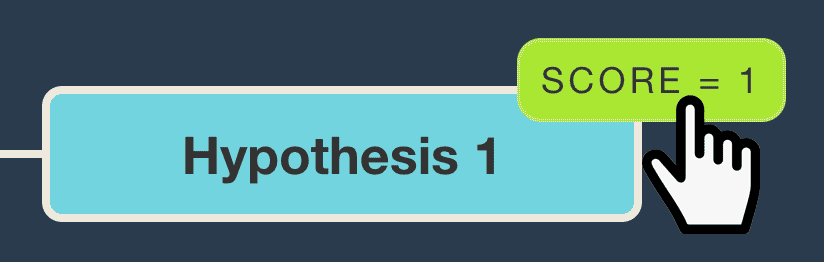
To focus on a score, simply click on that score.
Then:
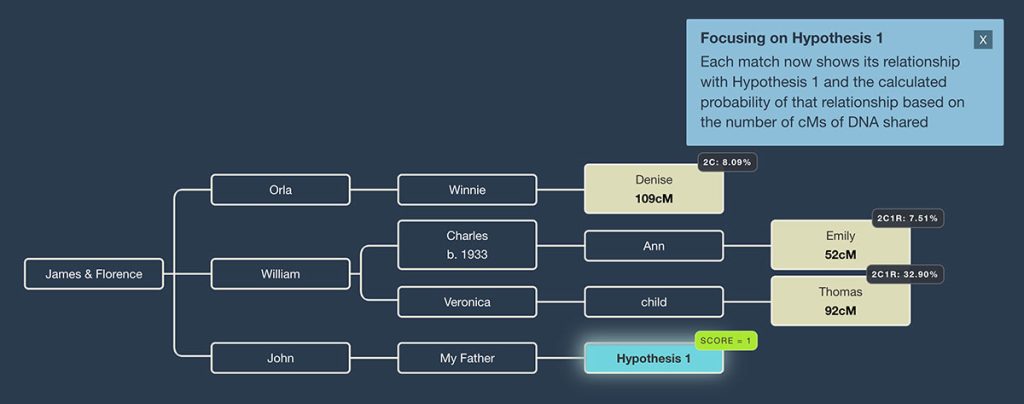
- A glow will appear around the focused hypothesis
- A blue box will appear explaining that you are now focusing on that hypothesis
- Each match will now have a badge showing its relationship to the focused hypothesis and the individual probability that the number of cMs shared is correct for that relationship
When you need to exit this focus mode, you can hit the Escape key on your keyboard, or click the little ‘x’ in the blue box.
Examples
Explaining a zero score
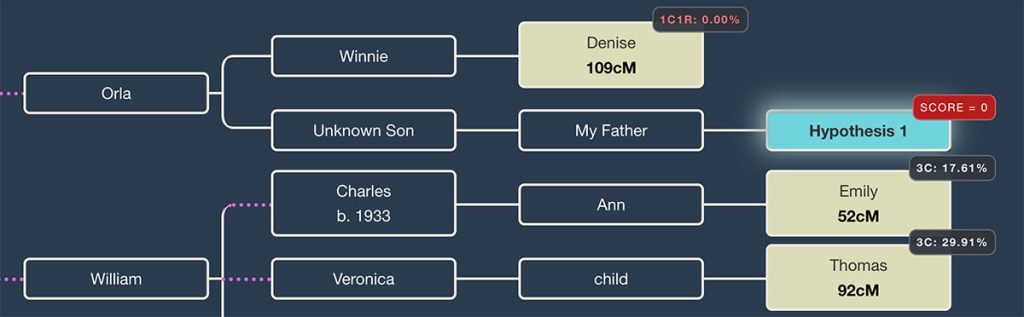
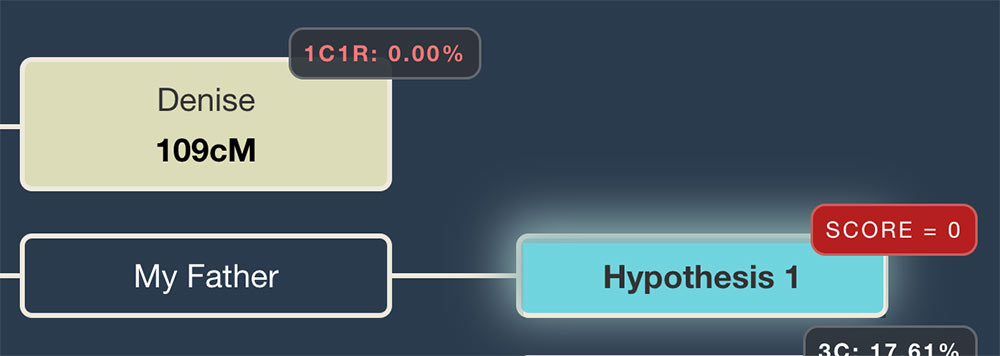
If I have a hypothesis with a zero score, I can focus on it to see which relationship is invalidating it. In this case, the position of Hypothesis 1 would make it a first cousin once removed (1C1R) to Denise. But the shared DNA amount of 109cM is not sufficient for this relationship and has a zero probability.
Explaining a higher score
If I add a new hypothesis and it gets a higher score, I can focus on each to see why the scores differ. Hypothesis 1 has a score of 1, while Hypothesis 2 has a score of 11. This difference isn’t really high enough to be significant, but if I’m curious I can click on the scores to compare them in more detail.
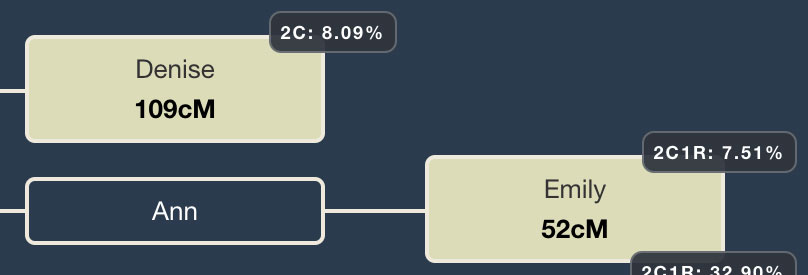
When I focus on Hypothesis 1, I can see that the probability that 109cM is a second cousin is only 8%, while the probability that Emily is a second cousin once removed sharing 52cM is only 7.5%
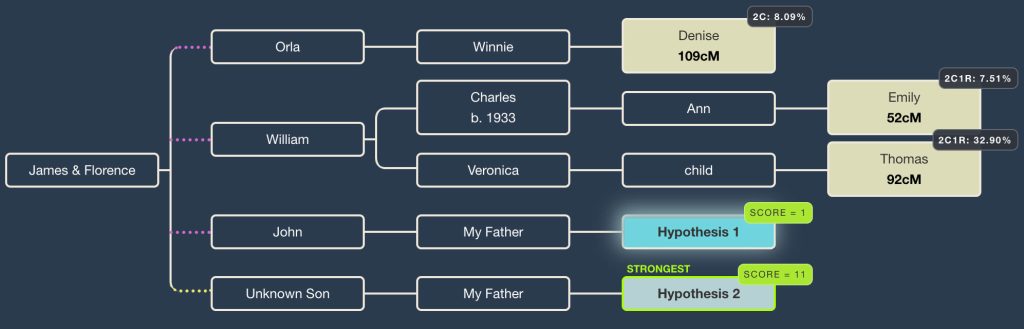
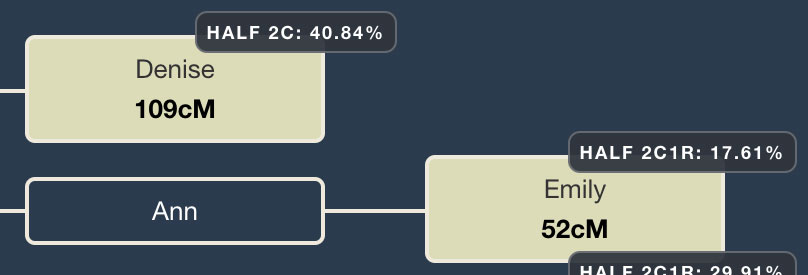
By contrast, focusing on Hypothesis 2 shows me that these shared cM amounts are much more in line with half relationships: 109cM has a 41% probability for a half-2nd cousin, and 52cM has an 18% probability for a 2C1R.

Does this mean Hypothesis 2 is correct? Absolutely not. In fact, Hypothesis 1 is correct; I just happen to share less DNA with Denise and Emily than would be typical. Other tests in the family confirm this. As with any problem-solving attempt, the more data and evidence you have, the better!
Thanks
Many thanks to Nancy in the WATO group for making the suggestion. As always, all feedback is welcome.
Contact info: @dnapainter.bsky.social / jonny@dnapainter.com