I’m pleased to announce the new DNA matrix tool at DNA Painter, which lets you visualize and analyze how much DNA a group of testers share with each other.
Note: If you’d like to see a demonstration and hear a spoken explanation, you can watch my free webinar on the matrix tool at familytreewebinars.com. There have also been two posts about subsequent updates to the tool:
Since I first took a DNA test in 2016, I’ve gone on to test as many members of my family as possible. The gradually reducing price of tests has made this easier. Most recently, I tested a great-niece and a great-nephew. Once the results came back, their parents wanted to know:
- How much DNA does their child share with other tested family members?
- How does this compare with what might be expected for that relationship?
This second question is particularly interesting for me, as it will be for all of us who have observed marked differences in amounts of DNA they share with relatives.
Keen to get this information into a convenient format for sharing, I built a new DNA Matrix tool. I hope this will help make the process of sharing and analyzing shared DNA amounts easier for everyone.
You could also potentially use the matrix tool for matches where the connection is unknown, analyzing connections and making notes.
You can find the matrix tool within the tools tab on the DNA Painter homepage once you’re logged in. I’ve also made an example matrix that you can use to explore how it works (similar to the example chromosome map I made back in 2017!)
Matrix?
When two people share DNA, the total amount they share is expressed as a number of centimorgans (cM). When collating these shared amounts for several related people, we can arrange the data in rows and columns.
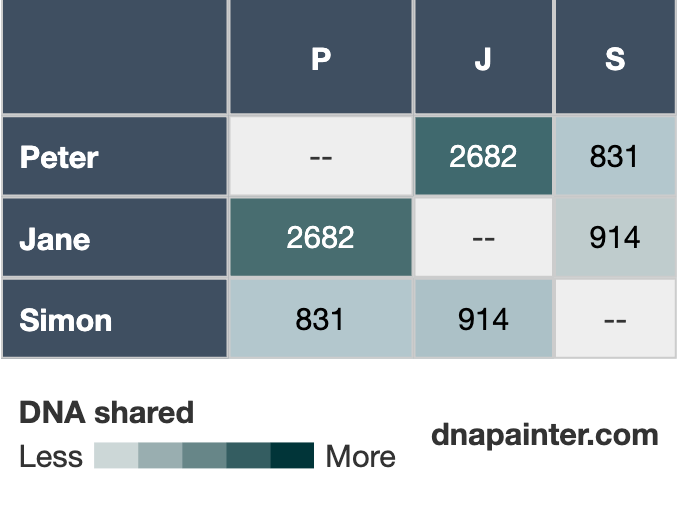
The resulting matrix provides a concise grid of data in which we can quickly look up the amount that two people share. In addition, we can use shading on the grid cells to provide further information. By default, cells are shaded according to the amount shared.
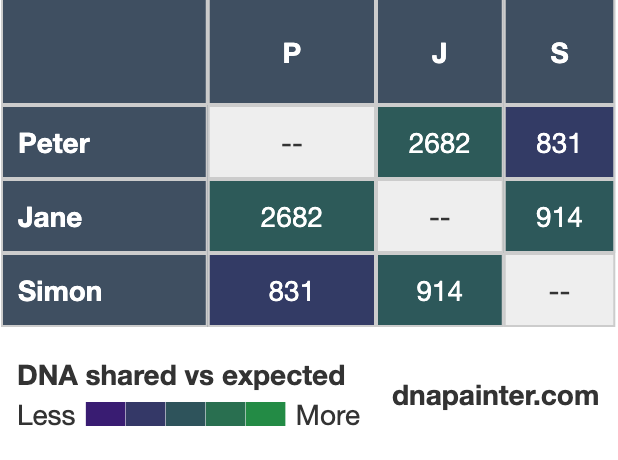
Perhaps most interestingly, if as well as the amount shared, the tool knows the genealogical relationship between two people, we can also shade the cells according to how strong the genetic connection is compared with others who share that relationship.
Entering and editing data
When you first visit the tool, you’ll see an introductory message with a link to the example matrix and to this blog post.
Manual entry
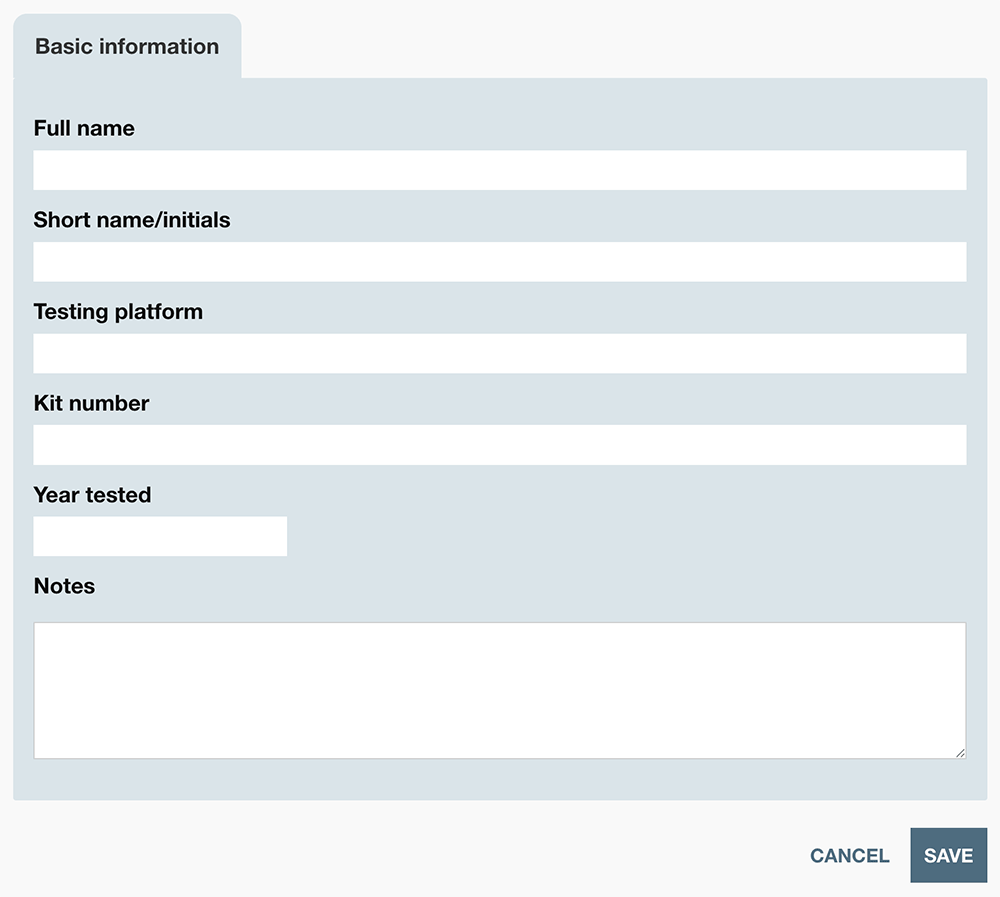
You can enter data manually by clicking Add tester at the bottom left of the screen.

Enter the tester’s name, and optionally add the testing company, kit number, year tested and other notes. If you have two testers with the same initials, you can also add a custom short name that will be used in the matrix column headers.
Once you click Save, you can add further testers and start to enter the amounts they share with each other and their relationship. There are two ways to do this:
Edit mode
If you click Edit mode, the number cells in the grid will become editable and you can add them in one go, clicking Save when you’re done.
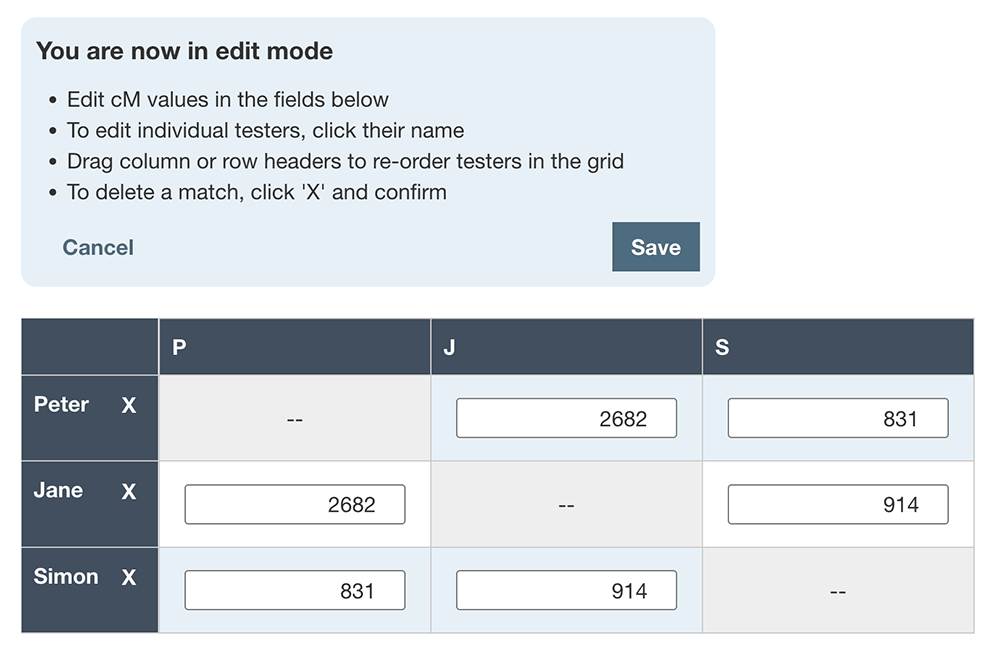
Other features within edit mode include:
- To delete a tester, click the X next to their name and confirm
- To reorder the grid, you can click and drag a tester and drop them in a new position
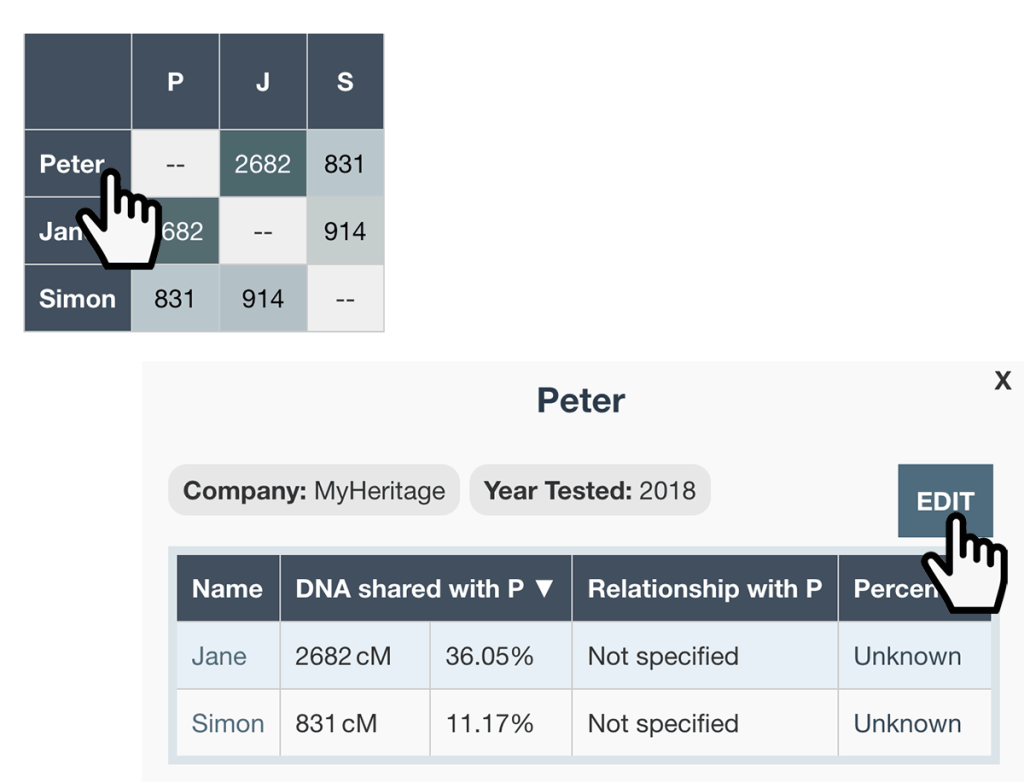
Editing a tester individually
Alternatively, you can add or edit shared amounts and relationships for an individual. To do this, click their name within the left-hand row header, and then click Edit:
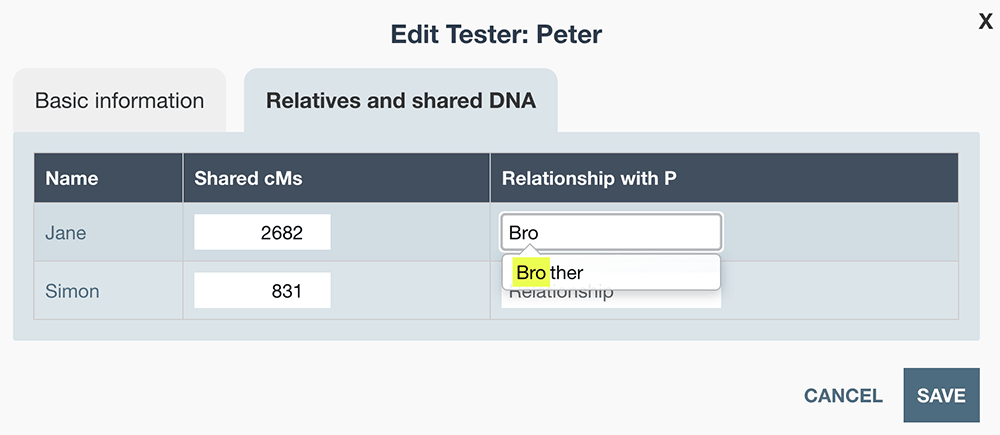
You can then click the Relatives and shared DNA tab. In the example below, Relationship with P is an auto-complete field. As you type, a list of matching relationships will appear. Once you see the correct relationship, click it. In the example below, Brother will be normalized to Sibling after you click.
Importing data
If you already have a spreadsheet containing this information, or if your testers are at Gedmatch or FamilyTreeDNA, you can save time by importing the data. At present, relationship information has to be input manually.
Gedmatch matrix
If you’ve uploaded your testers to Gedmatch, you can transfer the data into this tool as follows:
- Go into One-to-many: Original version (or if you’re a Gedmatch subscriber, one of the One-to-many versions under Tier 1 tools)
- Check boxes to the left of the kits of interest.
- Click the Visualization options button above the results table
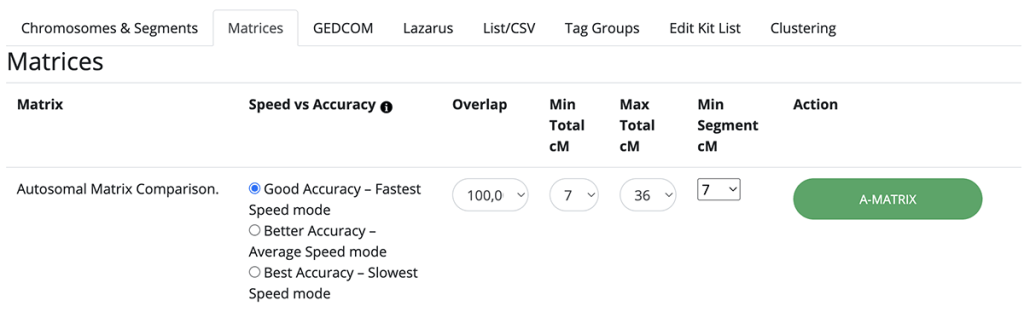
- Click the green Visualization options button, and then click Matrices
- Click Best Accuracy and then click A-Matrix. A table will be generated
- Select this table and then copy it into your computer clipboard (CTRL-C or CMD-C on a Mac)
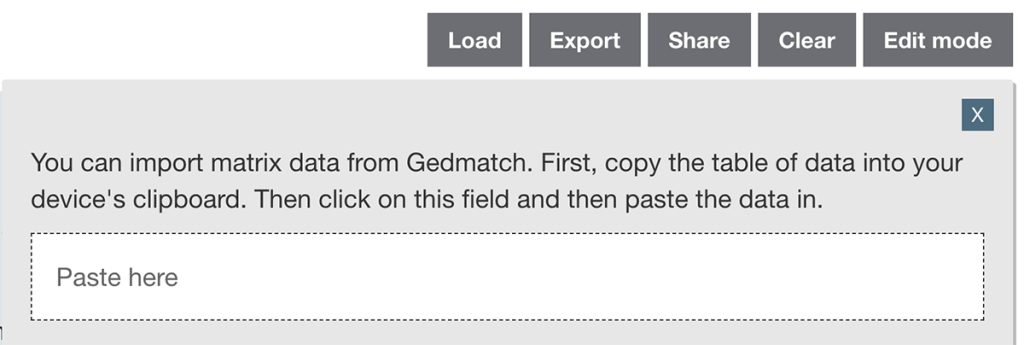
- Then within your matrix at DNA Painter:
- Click Load
- Click on the Paste here field
- Paste the data in (CTRL-V or CMD-V on a Mac)
FamilyTreeDNA Matrix
FamilyTreeDNA recently revamped their matrix tool so that it includes shared cM amounts for all selected users. First, go to your autosomal matches list.
- You’ll see a checkbox to the left of each match
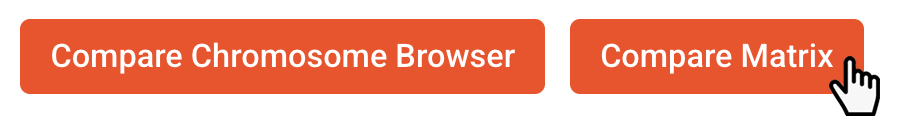
- After you check up to 10 matches, you’ll see a panel at the bottom with a button that says Compare matrix
- When you click this button and scroll down the page, you’ll see a table.
- You can select and copy this table into your computer’s clipboard and paste it in as described above for Gedmatch data.
CSV
You can also paste data from a spreadsheet (such as Excel or Google Docs) into this field. Or alternatively, further down within the Load menu, you can browse for a CSV file. (This file will need to be formatted as per this example CSV; essentially a spreadsheet version of the tables mentioned above.)
JSON
Display options
At the top of your matrix, you’ll see options Show and Shading. Once you click on an option, it will be retained by default in your web browser.
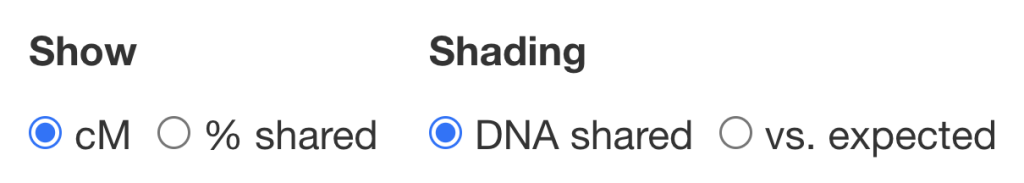
Show
The show option controls how the amount of shared DNA is shown. By default, amounts will be displayed in cM as entered. If you prefer, you can display this as a percentage.
Shading
As noted above, the boxes will by default be shaded according to the amount of DNA shared, with darker boxes for closer genetic relatives, and paler for those who are more distant.
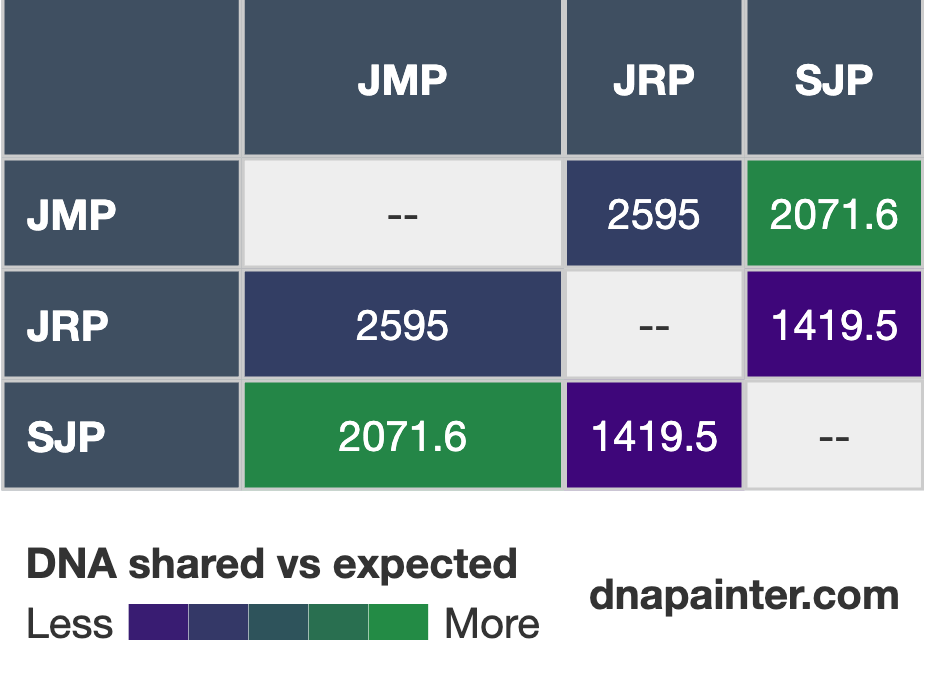
You can also shade according to the amount shared vs what would be expected for the relationship. A lower percentile means less DNA shared than usual for that relationship; a higher one means more than typical. For example:
- I share 2,071cM with my niece
- This is more shared DNA than ~96% of cases in the shared cM project
- The shading is therefore green, representing the 96th percentile
- My brother shares 1,419cM with that same niece
- This is less shared DNA than ~95% of cases
- The shading is therefore purple, representing the 5th percentile
- My brother and I share 2,595cM, which is in the 45th percentile (slightly below the average)
- The shading therefore falls near the midpoint between green and purple, indicating a typical amount for this relationship
Clicking on elements in the matrix
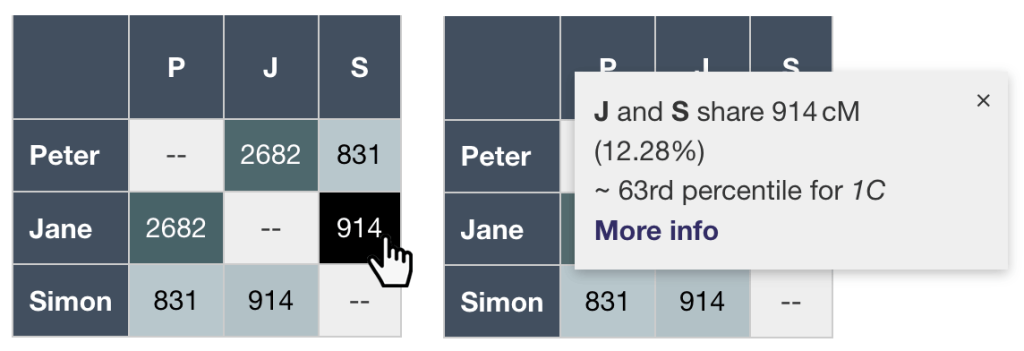
Click on a cell to see more information
When you click on a cell that shows how much DNA two people share, a dismissable panel will appear with additional information.
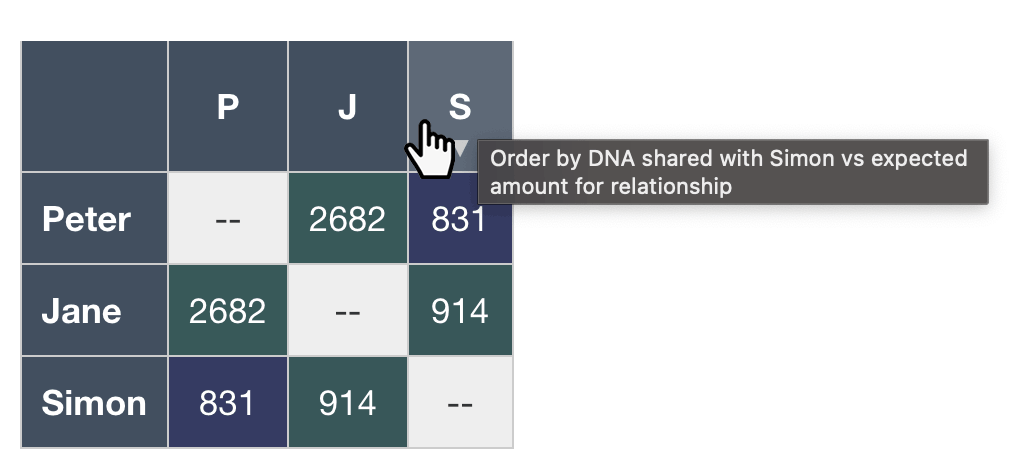
Click on column headers to reorder
You can click on any column header, and the table will then be reordered as follows:
- The person represented by the column you clicked on will appear first
- The other testers will then be ordered by whichever metric is active for shading:
- If shading is set to DNA shared, those who share the most DNA will appear first
- If shading is set to vs. expected, those who share in the highest percentile for the relationship will appear first
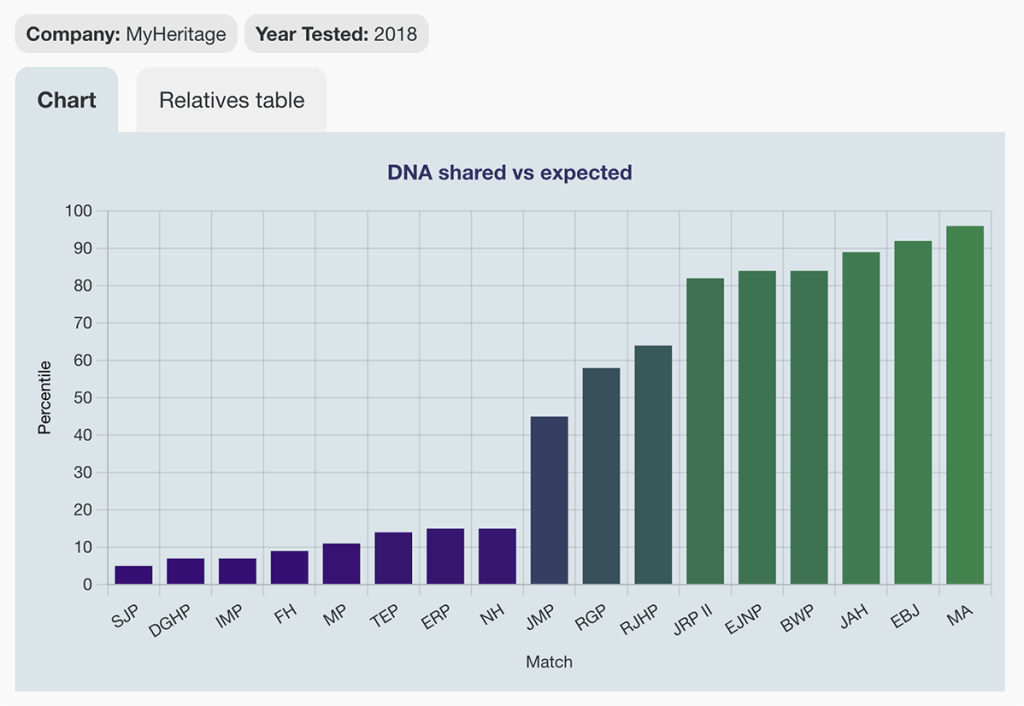
Detail view
If you click on any name, an overlay will appear:
- If you’ve entered the testing company, year tested or any notes, this will appear
- If you’ve entered relationships and shared amounts, a graph will appear showing which relatives this person is most strongly linked to genetically compared with the expectation for their relationship
- A table showing shared amounts and relationship (if entered) is also available when you click Relatives table.
As you can see, once you have several testers entered, this can reveal some rather striking differences between how much is shared vs the expected amount.
Exporting and sharing
As I mentioned, I was motivated to build this tool in order to make it easier to share this information, which to a certain type of person is extremely interesting! Within the top menu you’ll see both Export and Share buttons.
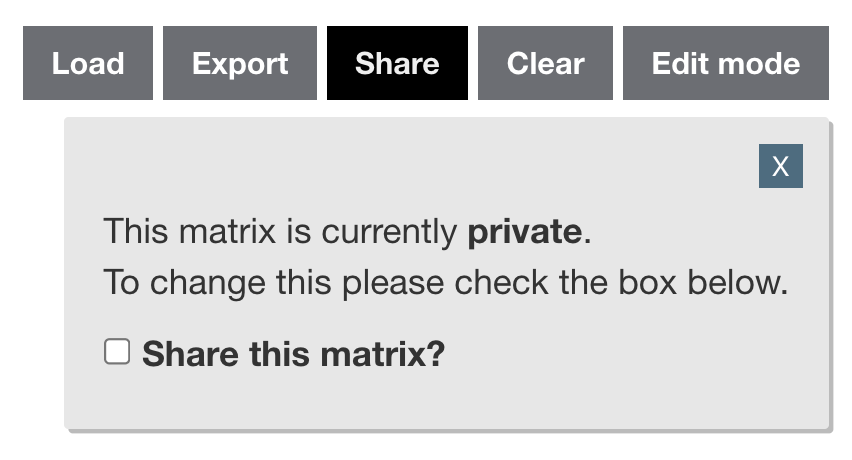
Share
When you click Share, you’ll see a small overlay that will be familiar to you if you’ve used the WATO, WATO plus or Coverage tools:
- By default, your matrix is visible only to you
- If you mark it as shared, the tool will generate a share link
- Anyone with this link will be able to view the matrix in read-only mode
- By default, only initials (or whatever you have in the short name field) will be shown
- If you want to show full names, uncheck the box Shorten names for privacy
- If at any time you want a shared matrix to be private again, you can uncheck the box share this matrix
Export
Clicking Export reveals several options:
- Duplicate matrix makes a copy of the current matrix and then takes you to that copy
- Save an image downloads an image featuring the current matrix view to your device
- Export matrix as CSV downloads a simple CSV file for Excel showing testers and shared amounts
- Export matrix JSON data downloads a JSON file containing all tester, shared amount, and relationship data you’ve entered
- You can load this back into the tool via the Load menu
Access to the DNA matrix tool
Similar to other features on the site, any registered user can have one matrix, with a DNA Painter subscription required for further matrices.
To create your own matrix, click here.
Technical notes
- Where percentages are shown, these are based on a total of 7,440cMs as they are in the Shared cM Project tool
- The percentile data is based on the latest iteration of the Shared cM Project, and will change whenever a new update is released
- Most testing companies do not include the shared amount of XDNA in the total, but you might want to include this info if you have access to it
- If you enter Parent-Child relationships into the tool, you’ll notice that a percentile value is generated
- This is not meaningful, since the proportion of DNA you inherit from a parent does not vary significantly; any variation is likely due to testing company algorithms
- In future I may omit these percentiles or include an option to omit them
- When prototyping and developing this feature, I made use of AI via ChatGPT 03 and 04
Planned features
I’ve had a lot of fun building this tool and have already enjoyed sharing the output with friends and family. I have the following on my list for enhancements:
- Entering relationships manually can be a bit time-consuming
- I’m hoping to be able to develop a family tree upload so that if you select users from that tree, their genealogical relationship with other testers will be pre-filled
- It would be nice to allow users to customize the colours used in cell shading
I also expect that new features will come to mind as I use the tool to analyze more unknown DNA matches as opposed to collating family sharing amounts.
Thank you for checking the tool out, and if you have any feedback or suggestions, please get in touch!
Contact info: @dnapainter.bsky.social / jonny@dnapainter.com