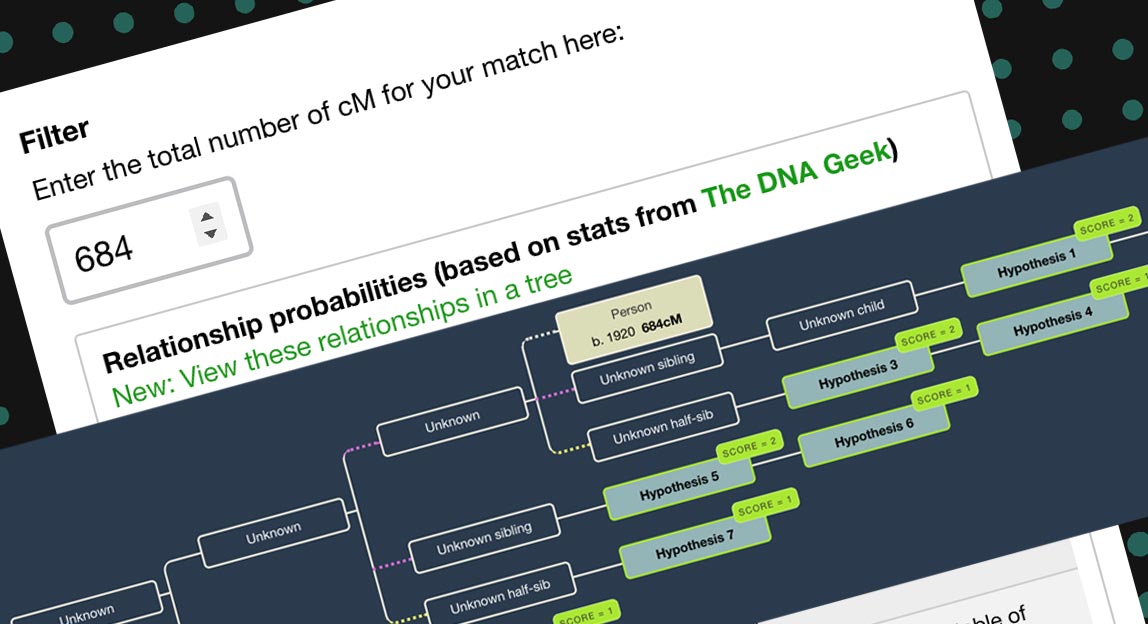
There’s a new feature in the Shared cM Tool. You can now view the potential relationships for a specific number of centimorgans (cM) shared in a tree format. Here are some notes on how this works.
The Shared cM Tool
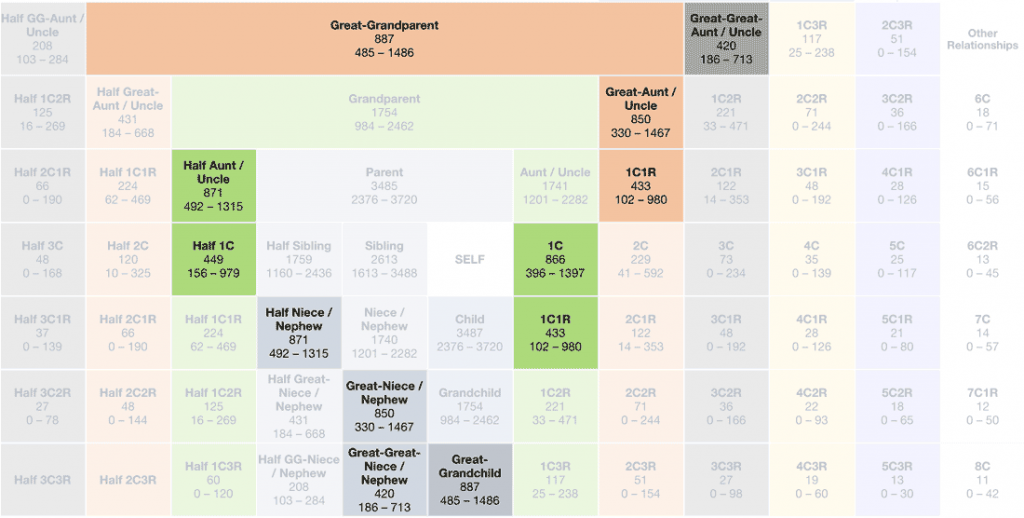
A popular destination at DNA Painter, this tool allows you to enter the number of cMs of DNA that you share with a match. It will then display a filtered set of possible relationships based on Blaine Bettinger’s crowd-sourced project. For more information, please see my blog post on the March 2020 update, and Blaine’s blog post and full report from the same time.
What are the Odds? (WATO)
WATO, another tool at DNA Painter, lets you build a simple tree for your matches. It then uses probabilities to help you figure out where you’re mathematically most likely to fit into the tree based on the cMs you share with these matches.
A collaboration with Leah Larkin and Andrew Millard, WATO has helped lots of people to solve genealogical mysteries. For more information, read Leah’s blog following the release of v2 last year.
The new capability
You can now visualize your shared cM amount in a WATO tree with one click. The probabilities from WATO have been in the Shared cM tool since late 2017, but this new link provides an additional springboard for those who would like help visualizing connections.
Once you’ve entered your shared cM amount, you’ll see an additional link above the table of probabilities:
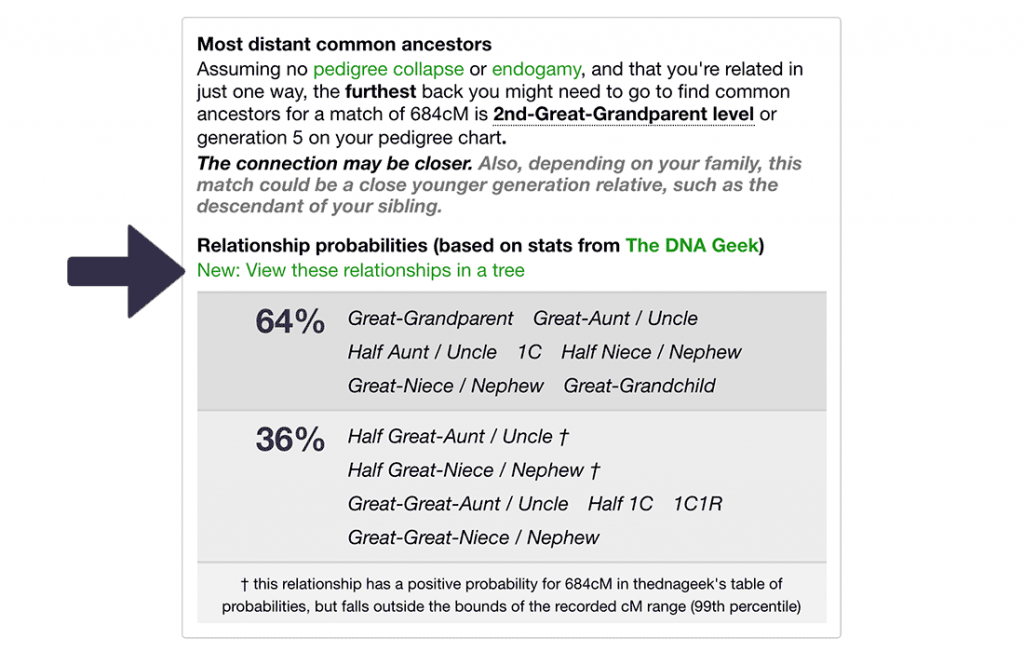
Clicking this link will do the following automatically:
- Create a new WATO tree in ‘scratchpad’ mode (that is, it will not be saved unless you explicitly click ‘Save’ and then ‘Save tree’)
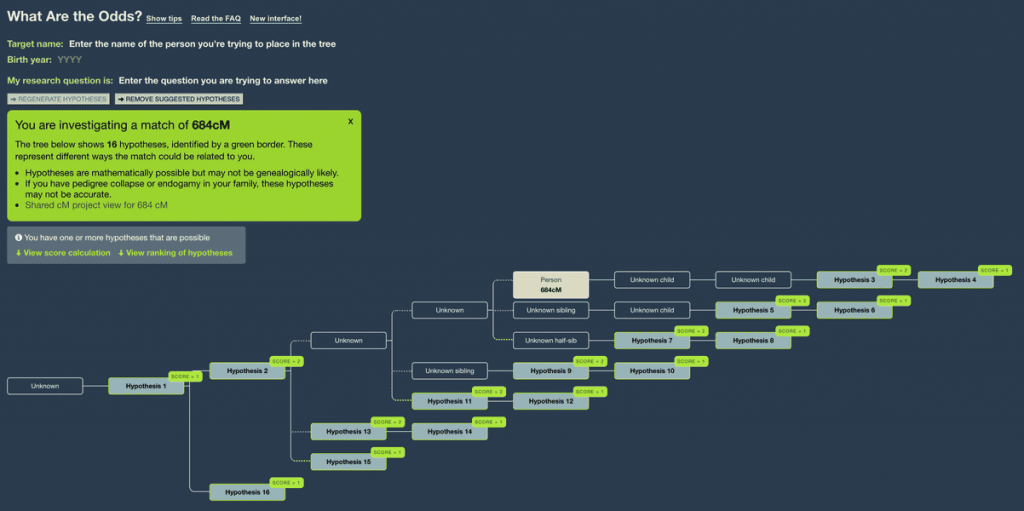
- Add one match called ‘Person’ with the shared cMs you specified in the shared cM tool
- Generate a tree with hypotheses based on the probabilities for this number of cMs shared.
Narrowing down the results
In the first instance, this helps you visualize what these relationships mean. But even for a match as significant as 684cM, there are many different possible relationships.
You will therefore want to reduce the number of possibilities by providing genealogical information:
- Add your birth year at the top of the page (in the Birth Year field under under ‘Target name’)
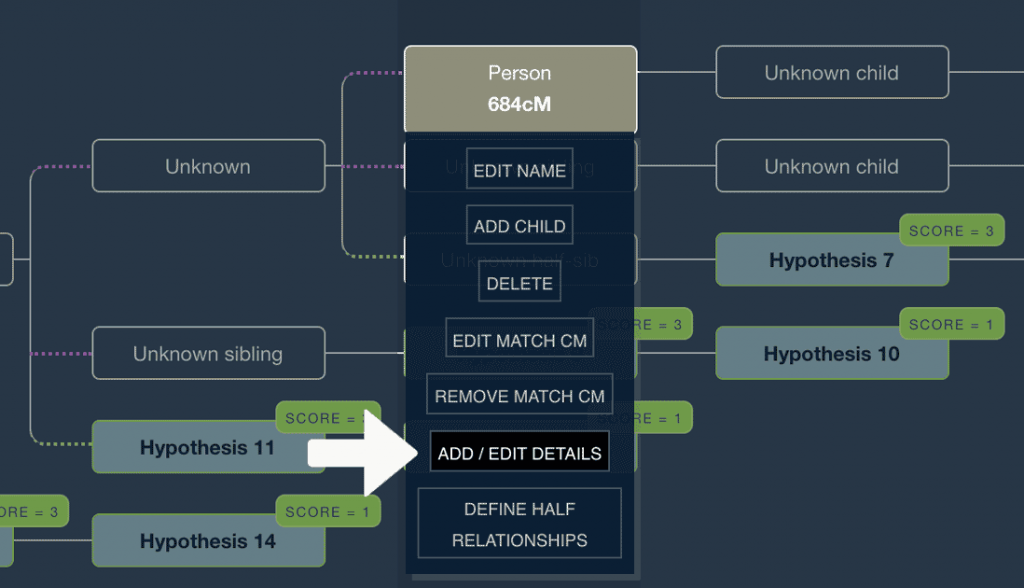
- Add the match’s birth year (or an estimate) by clicking on the match and clicking ‘Add/edit details’, entering a year and then clicking ‘Close’
Once you’ve done this, WATO will be able to rule out some hypotheses based on age.
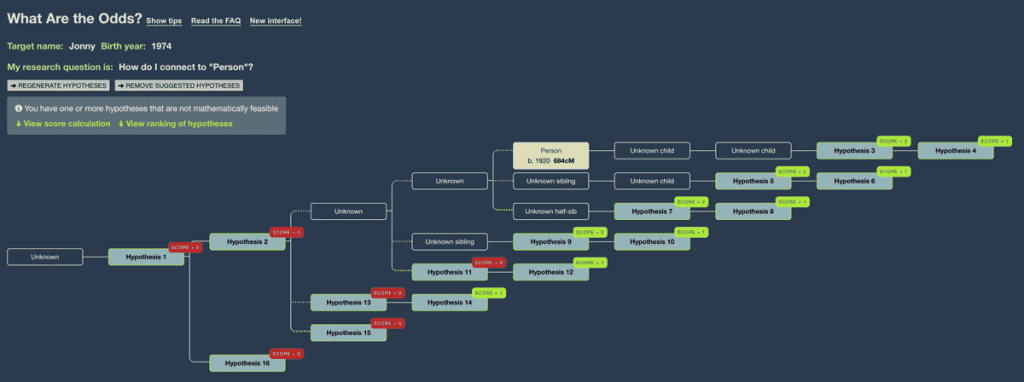
If you click ‘Regenerate Hypotheses,’ WATO will remove hypotheses that have been ruled out.
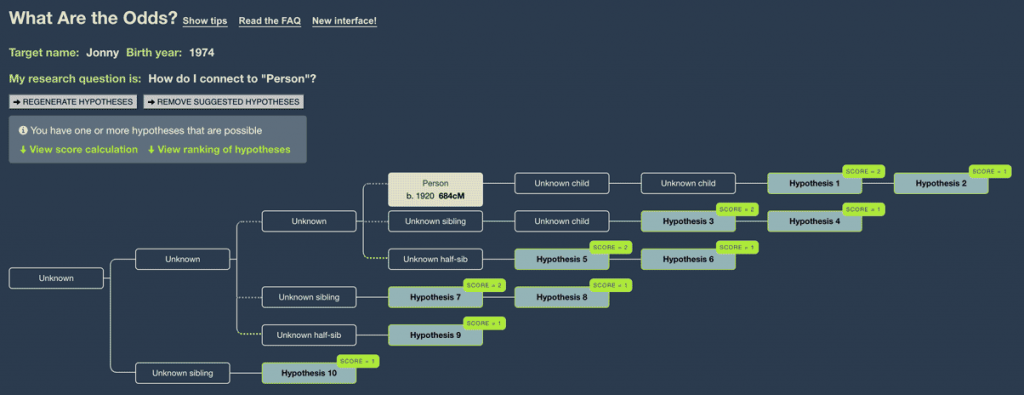
At this point, you can start to rule out ‘extreme genealogy outlier’ hypotheses. For example, the following is biologically possible:
- “Person” born in 1920 had a child born in 1934 at the age of 14
- …who had a child born in 1947 a the age of 13
- …who had a child born in 1960 at the age of 13
- …who was then your mother or father at the age of 14 when you were born in 1974
- …who had a child born in 1960 at the age of 13
- …who had a child born in 1947 a the age of 13
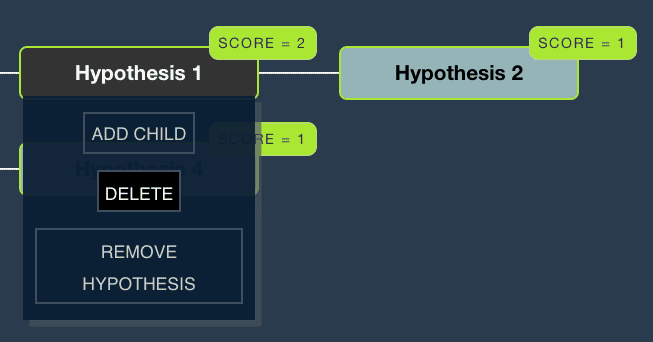
But it’s extremely unlikely! You can remove any node in the tree (and its children) by hovering and clicking ‘Delete’.
Please also bear in mind the following very important points:
- For lower cM numbers, the range of possible relationships is huge, and the actual relationship could date back far beyond the generated tree (and indeed the genealogical timeframe).
- If the tree doesn’t seem to make sense, remember that the probabilities can’t take into account multiple relationships or endogamy.
A note on probabilities
There are two versions of WATO:
- Version 1 with probabilities derived from Ancestry’s White Paper on Matching from 2016.
- These are also used in the shared cM tool
- Version 2 with beta probabilities
- There’s a beta version of the shared cM tool that uses these probabilities
These probabilities occasionally differ significantly. Which is better? I can’t say. The version 1 probabilities are documented in Ancestry’s White Paper on Matching from 2016, while the newer probabilities were derived from those being used on Ancestry’s site in 2020 after they introduced this feature. For more information, please see Leah Larkin’s blog post.
Overall, I find the original probabilities more useful, mainly because the newer ones seem to discount the possibility that a small match (say 20-30cM) is actually a very remote relationship. For example:
- A 20cM match is given only a 4% probability of being more distant than a 5th cousin
- Based on personal experience, my feeling is that this probability is actually much higher.
You can use ‘view these relationships in a tree’ from both versions of the shared cM tool. Doing so will not surprisingly generate slightly different trees.
I hope you find this experimental feature useful. If you have any feedback or suggestions, I’d love to hear from you!
Contact info: @dnapainter.bsky.social / jonny@dnapainter.com
