The day has arrived! Version 4 of the Shared cM project is now out, and there’s an updated shared cM tool as well.
Since 2015, Blaine Bettinger has been crowd-sourcing data on the number of centimorgans (cMs) of DNA shared for known relationships. The result is an incredibly useful dataset that helps genealogists start to figure out just how they might be related to an unknown match.
In September of 2017 I released a web-based version that lets you enter a number and then filters the results visually. And in December of 2017, I released an update that added probabilities, based on my work with Leah Larkin for What are the Odds. The shared cM tool has between 2 and 4,000 page views per day, with over 2 million since its launch.
I’ve put together this post in order to:
- Showcase the tool, now updated with an important new feature
- Clarify the different sources of data used
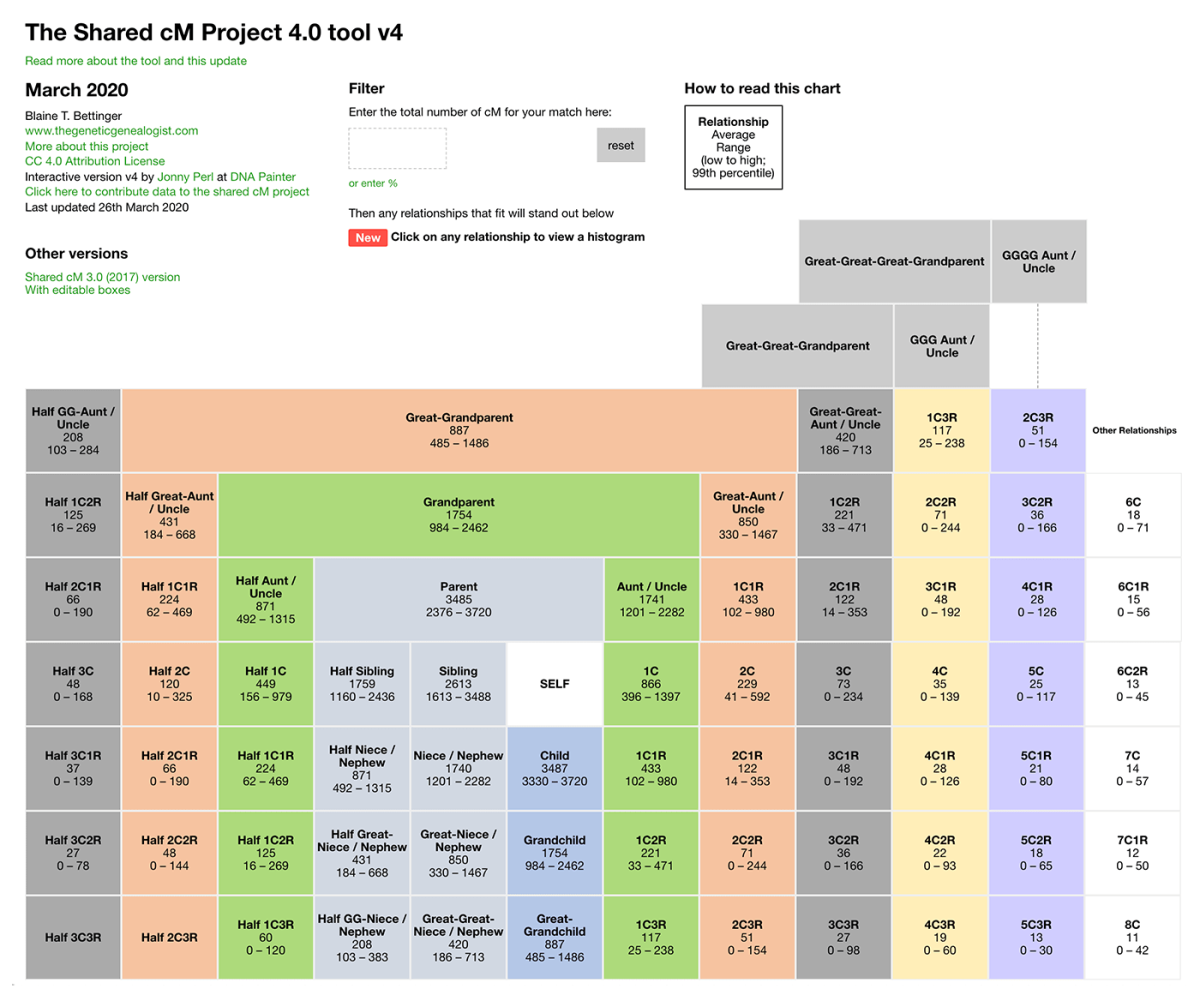
The updated shared cM tool
This latest release of the shared cM project uses data for nearly 60,000 known relationships. This means there are 147% more data points than in version 3, allowing for some extra resolution and detail in the numbers.
The tool itself is similar to before, but with the following improvements:
Updated numbers
The numbers in each relationship box have been updated based on the newly calculated figures. Most have not changed significantly, but in many cases the increased number of submissions has helped to define the expected ranges in far more detail. Blaine provides more detail on this at his site.
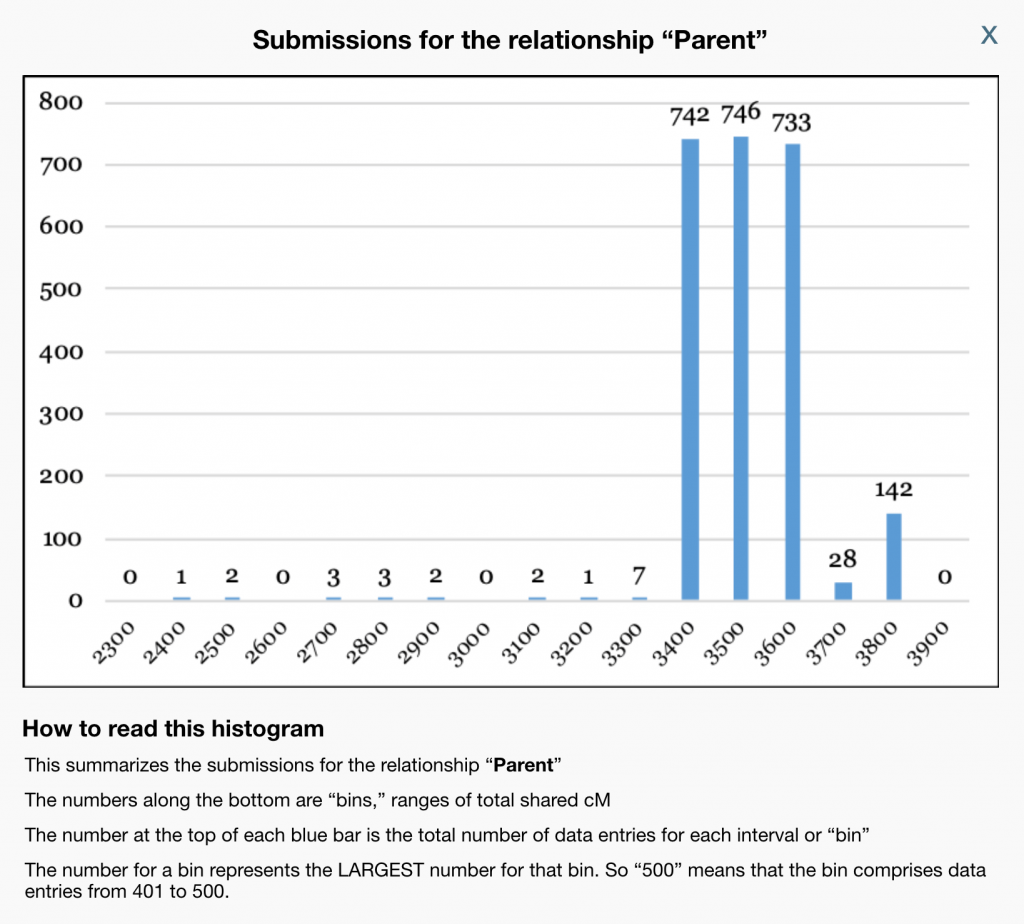
Histograms now one click away
You can now click on any relationship box, or any relationship as listed in the probabilities, and view a histogram in an overlay.
Each histogram shows the range of submissions for that relationship. This can help you understand where the relationship you’re considering could fit in.
As an example of how important the histograms can be:
- For the parent/child relationship, there were a few submissions showing a shared cM amount of less than 3,000cM
- The lower bound for this relationship has therefore dropped to 2,376
- Some of these may be outliers or typing errors; it’s not clear.
- But clicking on the histogram shows that the vast majority of submissions were in the range 3,300 to 3,900.
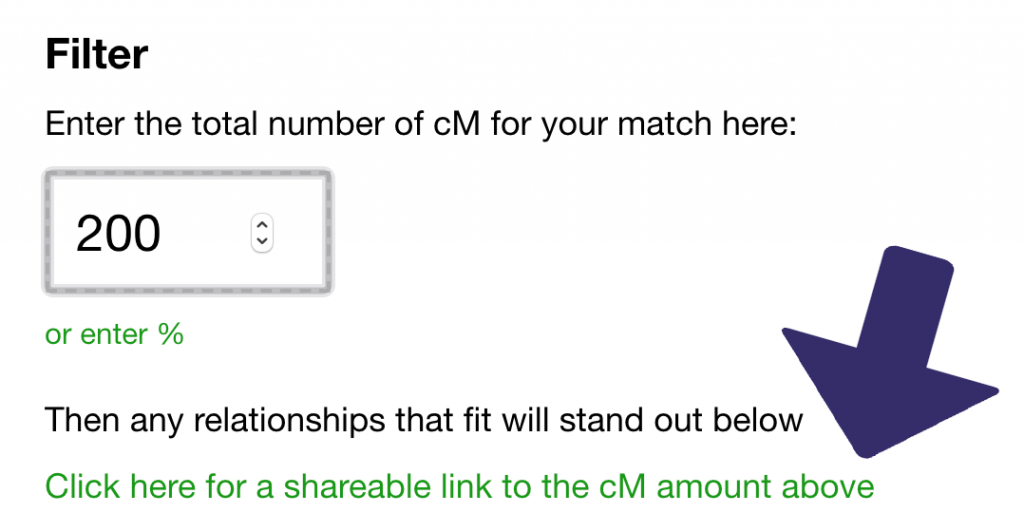
You can still easily share the results
There’s one feature that has been in the tool since early on, but which is underused:
- After you enter a number, you can click the link below to go to a direct link to the result for this amount.
- This then gives you a quick response to the question ‘Hey, do you know how we might be related’.
If for example you share 200cM of DNA with someone, you can send them this link, which concisely summarises the possible and most probable relationships.
Data used by the updated shared cM tool
Relationship boxes
Blaine Bettinger extracted the data in the relationship boxes from the collated submissions. In preparing the numbers, Blaine went through a careful process to remove outliers and obvious errors, which he describes in the full PDF report. The histograms mentioned above were extracted from this.
Relationship probabilities
The tool also provides a table showing groups of possible relationships grouped by how likely they are, with the most likely at the top.
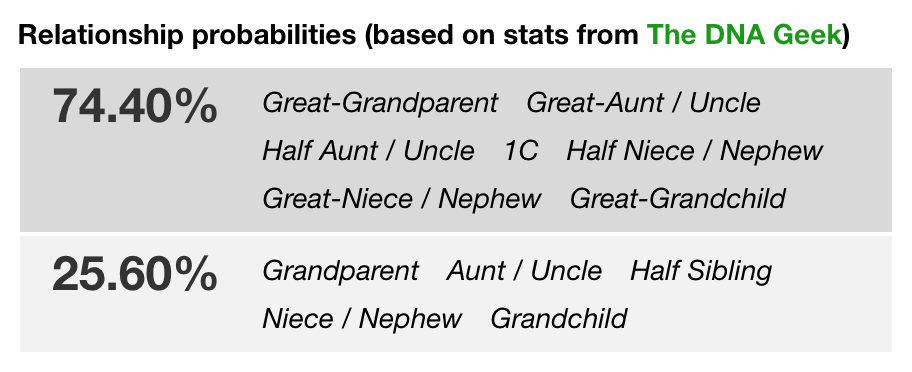
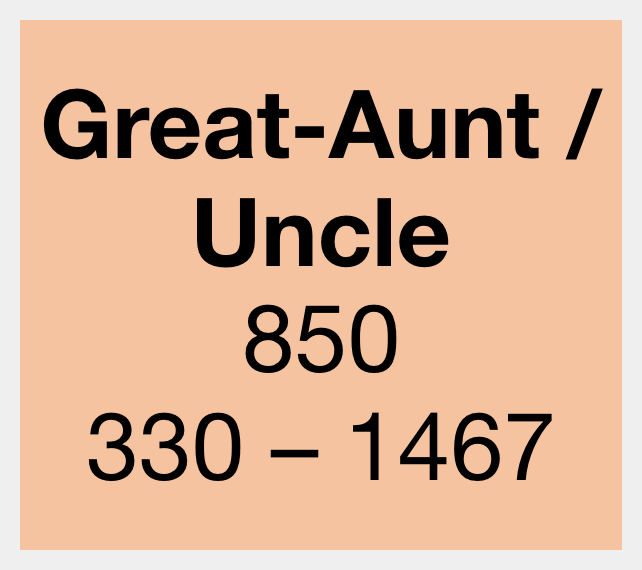
The data used for these probabilities comes from a completely different source: Figure 5.2 from Ancestry’s White Paper on Matching. This figure shows how likely it is that a specific number of cM shared equates to different relationships, based on Ancestry’s simulations. As explained in her blog, Leah Larkin used an online plot digitizer to extract the numbers used to make this figure.
It’s this data that allows us to estimate how likely for example it is that a 1,240 cM match is in the group first cousin; great-grandparent/grandchild; half niece/nephew/uncle/aunt; great-auntuncle/niece/nephew (about 74%) rather than from the group grandparent/grandchild; aunt/uncle/niece/nephew; half sibling (about 25%).
Disagreements
Since they are completely separate, it’s not surprising that occasionally the crowd-sourced data does not agree with the simulated data. For example, a match of 400cM could just about be a low-sharing 1st cousin according to the crowd-sourced data, but has a 0% probability based on the simulations.
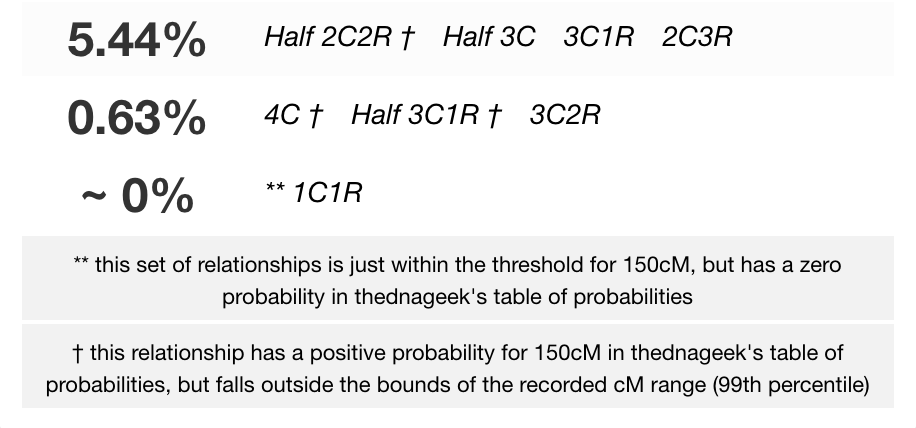
When disagreements like this occur, the tool notes this clearly below the probabilities:
- Below we can see that for 150cM, there are several relationships that have a positive probability but are outside the bounds of the shared cM project: Half 2C2R, 4C and Half 3C1R
- There’s also one relationship, 1C1R, where the probabilities state that it’s not possible, yet it falls within the recorded bounds of the shared cM project
Caveats for the updated shared cM tool
The same caveats exist as previously for the results. These now appear in a blue box on the left of the results (note they aren’t shown on mobile viewports for space reasons):

Multiple relationships or endogamy
Neither the shared cM project nor the simulations that underly the probabilities can handle multiple relationships/pedigree collapse or endogamy. Therefore if you have any of these in your ancestry, the results might not be accurate since the ranges of shared cMs will generally be much broader in these instances.
Averages
Averages in the relationship boxes were determined only for relationships in which DNA was shared. The more distant a relationship, the more likely it is that you won’t share DNA at all (read more).
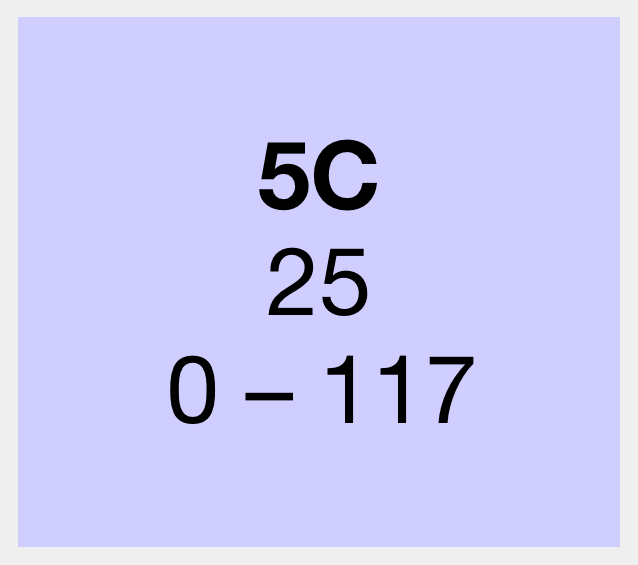
For example, the average given for a 5th Cousin is 25cM. But we will only share detectable DNA with around 10-30% of our 5th cousins. So here the tool is saying:
- The range of shared DNA for a fifth cousin is 0 to 117cM
- For 5th cousins with whom you share detectable DNA, 25cM is the average amount shared
Note that this isn’t therefore saying that 25cM is the average amount you’ll share with a 5th cousin, just that of those you *do* share DNA with, the average recorded was 25cM.
Thanks
I hope you enjoy the updated shared cM tool and find it useful. The tool is in the same place, and also includes a link to the old tool for comparison.
Many thanks to everyone who has contributed data to the project, and to Blaine for conceiving and updating it. And if you haven’t yet done so, please consider submitting your own data to the project here.
Any other feedback is obviously also welcome!
Contact info: @dnapainter.bsky.social / jonny@dnapainter.com